
Why The Salt Lake Tribune chose Chartbeat: Affordable real-time analytics that help journalists
Share this story:

From red desert rocks to green alpine meadows, Utah offers hikers an embarrassment of riches. Local hiking content should be a natural fit for The Salt Lake Tribune.
Not really, according to data from content analytics platform Chartbeat.
“We’ve written about these hikes,” says Ian Swenson, director of news and audience analytics at the Tribune. “We’re not getting (much) response there.”
Readers looking for hiking content are likely to visit sites devoted to the subject, rather than the local paper, Swenson says. “We know there’s a huge potential audience for it, but we’re not capturing that audience. So maybe we should spend our attention somewhere else.”
On the other hand, religion coverage does well in Mormon-dominated Salt Lake City, according to Chartbeat data.
This is precisely the kind of insight that makes Chartbeat valuable for newsrooms seeking data-driven editorial decisions. Rather than guessing what resonates with readers, the platform provides real-time analytics that help editors and reporters understand their audience and adjust coverage accordingly — turning hunches into actionable intelligence.
That insight “actually affects the journalism, affects the questions you’re asking, what kinds of calls you’re making,” Swenson says. “You figure out who your audiences are and what your approach to the story is going to be at the very outset.”
That’s the goal, says Charbeat Customer Success Manager Brad Streicher. “We’re empowering journalists to transform their newsrooms by putting data at the center of their decisions,” he says. Users can see what stories are resonating with their audiences and what aren’t, and respond accordingly.
Three reasons to use Chartbeat
- Chartbeat’s real-time dashboard lets newsrooms see, minute by minute, whether stories are finding the expected audience.
- Headline, text and image A/B testing can help stories get better traction with AI-generated options and automatic optimization.
- Engagement metrics help build sustainable audiences, focusing on time spent reading and site loyalty, rather than just clicks.
Newsroom overview
With around 30 reporters and 100 total staff, the Salt Lake Tribune is “a decently mid-size newsroom,” Swenson says.
Founded in 1871 as The Tribune & Utah Mining Gazette, the Pulitzer Prize-winning publication converted to a nonprofit in 2019. It was the first legacy newspaper to make that transformation, following years of financial turmoil that have rocked the newspaper industry since the dawn of the internet. The Tribune receives support from large and small donors, as well as philanthropic foundations, in addition to subscriptions and advertising revenue.
Swenson’s role as director of analytics is “less in the day-to-day of the newsroom, but more big picture,” he says. It straddles the editorial and business sides of the publication.
He uses analytics to help reporters and editors shape their coverage “so it reaches the audiences that they’re trying to reach,” he says. He also monitors what drives subscription and donation figures and how that data can inform strategic decisions.
Problem: Knowing readers’ behaviors
What happens to an article once you hit the publish button? Do readers find it? If they do find it, do they come back for more? Do readers become paying subscribers?
“That data is incredibly crucial,” says Chartbeat’s Streicher. “Rather than just writing articles and then sending it out into the internet — it’s kind-of blind from there as far as what happens. Having data to make strategic decisions in your newsroom is something that Chartbeat solves.”
For example, how should a local paper cover the opening of a new restaurant? Without analytics, Swenson says, dining reporters tend to focus on profiling the chef.
“What we find when you look at the analytics is, those types of stories don’t get read very well,” says Swenson. Focusing the headline and lead paragraphs on what the diner will experience brings in more readers.
“I’ve definitely worked with several dining reporters over the years where that transition makes a big difference,” Swenson says. That doesn’t mean ignoring the chef’s story. It just means drawing in the reader first. “While they’re in there, they can read this great profile about the chef.”
Meanwhile, with Chartbeat data in hand, “we’ve doubled down on our religion coverage over the years,” Swenson says. This year, they went from one-and-a-half reporters on the beat to three full-time religion reporters. “And that has led to an increase in the number of religion stories as well as an overall increase in how well they’re reaching audiences.”
Solution: A data-rich dashboard
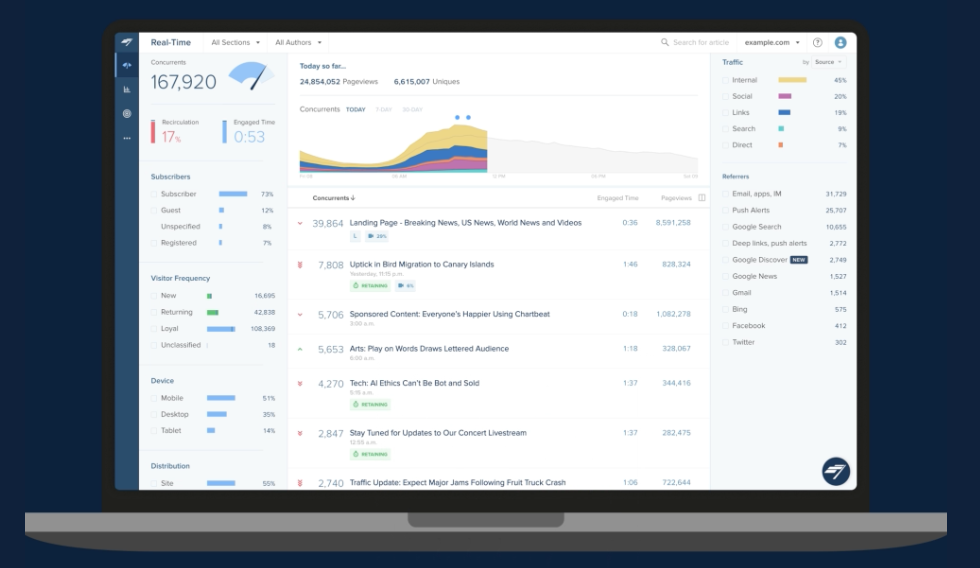
Chartbeat’s real-time dashboard is “our bread and butter,” Streicher says. It’s divided into three sections: “ ‘who’ on the left, ‘what’ in the middle and ‘where’ on the right-hand side.”
The “who” section shows who is on the site from minute to minute. That includes the total number of viewers, the time they spend on an article and what percentage of readers go from one article to another on the site, a metric known as recirculation. A breakdown of subscribers and guests, including new and returning visitors, the device they are using, and their countries, also appears on the left side of the page.
The “what” middle section ranks the articles that are receiving the most views at that moment. A graph displays traffic over time, including spike alerts when a story gets significantly more traffic than expected. Chartbeat also notifies users directly when an article is experiencing a surge in traffic.
“It’s a really good early indicator to go in and beef (the article) up,” Streicher says. “Do things like add related links, include multimedia elements, push it out on social. Just do anything you can to drive more people to the article, or get people to stay on the article longer or dive deeper into your website.”
The “where” right side of the page shows where readers are coming from, including search, social, internal traffic, and direct visits to the site. It tallies referrals from various search engines, email and messaging apps, social media platforms, and more.
Checking the box next to any item filters the data by that item. For example, checking “loyal” under visitor frequency on the left adjusts the page to show how many of these regular visitors are subscribers versus guests, the top stories they are reading, where they came from, and so on.
Chartbeat also offers a heads-up display to monitor traffic on the publication’s homepage. It shows what stories on the homepage are over- and under-performing compared to how stories in that position usually do. Editors can quickly swap items to maximize readership.
According to Swenson, Chartbeat’s “killer feature” is headline testing. “None of the competitors do that nearly as well,” he says. Provide a few options (or let AI generate them), and Chartbeat will identify the one that receives the most engagement.
Once it has identified a winner, Streicher adds, “you don’t need to change it in your CMS. You don’t need to alter it anywhere. You just literally click start, and we do all the work for you.”
But the app is not just aiming for clicks, he says. Time spent on a page is more important. Readers who visit more than one page on a site are more likely to return.
Streicher says Chartbeat encourages customers to focus on those metrics. “Because publications that are just focusing on clicks alone are not driving a loyal audience. And that means that you don’t have sustainability over time.”
Impact: More revenue, better journalism
The Salt Lake Tribune started using Chartbeat before Swenson arrived, so he says he can’t put hard numbers on the impact.
However, he says Chartbeat enables newsrooms to track which stories lead to paid subscriptions, newsletter sign-ups, or any other metric a newsroom deems essential. It can help maximize advertising revenue by optimizing headlines and other SEO factors, allowing a story to reach the widest audience possible.
But besides the financials, he says, it makes reporters better at their jobs.
“I’m a strong believer philosophically that reporters being aware of how their stories are doing is to everybody’s good, especially the readers’ good,” he says. Reporters can see in real time what’s working. And when a story doesn’t reach the expected audience, “it drives the sort of thinking about, ‘How…do I avoid that from happening next time?’ So, that awareness and usage of tools like Chartbeat just leads to better journalism.”
Security and privacy
Chartbeat masks IP addresses by default, requires HTTPS encryption for data transmission, and maintains strict access controls with role-based permissioning across all servers. Their terms of service explicitly prohibit sending personally identifiable information (PII) to Chartbeat. The company maintains comprehensive logging of permissions changes for at least 90 days and data requests for at least 30 days. All servers are hosted on Amazon Web Services with industry-standard physical protections.
Compared to major competitors like Google Analytics and Adobe Analytics, Chartbeat takes a more privacy-forward approach. While both Google Analytics and Adobe Analytics adhere to GDPR and CCPA privacy guidelines with controls for data anonymity, Chartbeat’s business model gives it some inherent advantages. Unlike Google, which has broader data collection interests across its advertising ecosystem, Chartbeat focuses solely on content analytics, reducing potential conflicts of interest around data usage.
Chartbeat’s business model is aligned with editorial rather than advertising interests. While enterprise-level platforms like Adobe Analytics may offer more granular privacy controls, Chartbeat’s privacy-by-design philosophy and content-specific focus make it particularly suitable for news organizations concerned about reader privacy and regulatory compliance.
Verdict: Essential data at affordable price
Newsrooms similar to The Salt Lake Tribune — mid-sized outlets balancing editorial quality with financial sustainability — would benefit from Chartbeat’s approach to audience analytics, particularly those seeking to optimize both reader engagement and revenue generation.
Chartbeat puts data at the center of newsroom decisions, helping editorial teams increase audience engagement, loyalty and revenue. For cost-effective answers to who is reading what on your website right now, Chartbeat is hard to beat.
Chartbeat typically costs around $13,000 annually. But the company says it’s preparing to launch Chartbeat Starter, an entry-level plan that would cost less.
Alternatives: Parse.ly, Marfeel
Swenson says he has used Chartbeat competitors Parse.ly and Marfeel. The Salt Lake Tribune uses Chartbeat because it “frankly, is the cheapest of the three,” based on The Tribune’s website traffic and other pricing factors.
Marfeel and Parse.ly “are more feature-rich than Chartbeat,” he says. “Marfeel, for example, has AI up and down their product. It’ll give you what you should tweet out. It’ll do all those sorts of things if you want. But I find that that’s not what most journalists are looking for. They’re looking for how (to) better connect with your audiences. And I think Chartbeat’s real-time approach is really doing that job.”
Parse.ly: Offers advanced audience segmentation, content personalization, and extensive data pipeline capabilities.
Marfeel: AI-powered platform with automated social media optimization, advanced mobile optimization, and comprehensive monetization tools. Targets publishers focused on mobile-first strategies.
Google Analytics: Free, provides basic tracking but less real-time capability. And it requires more technical setup.
The alternatives offer more features than Chartbeat, but the Tribune found that the core real-time analytics and headline testing capabilities met their needs at a more accessible price point.